Table of Contents
i. Opening and context
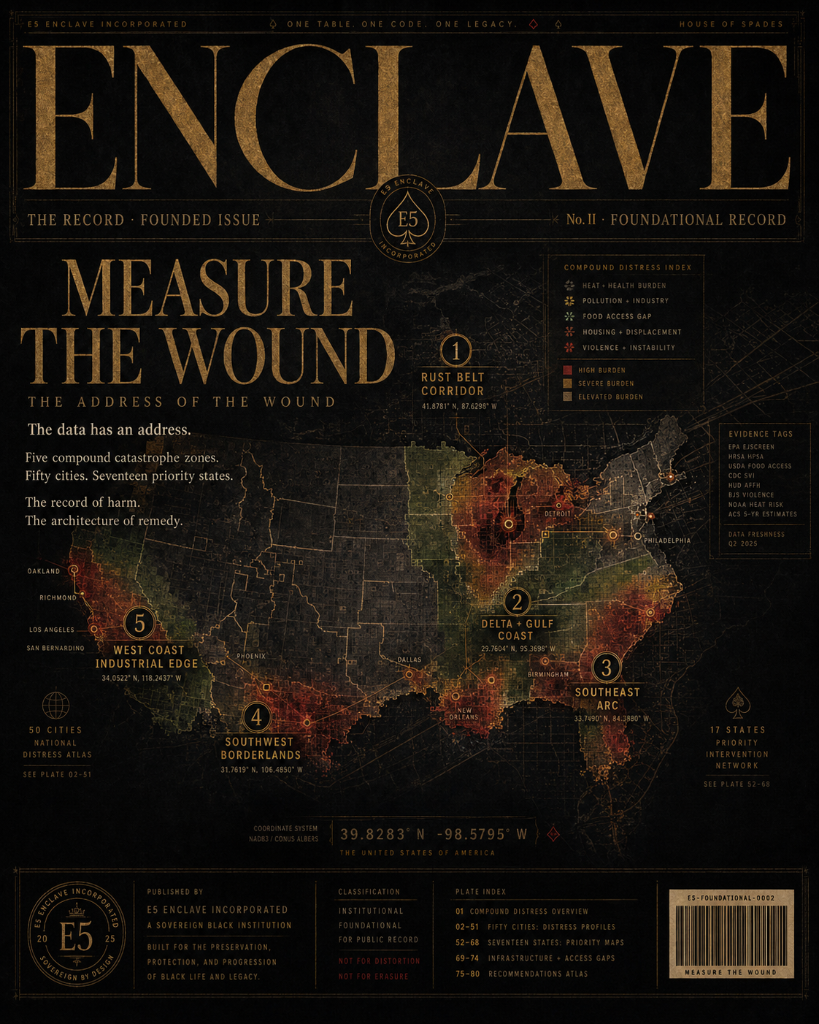
*Preface*We publish this paper in 2026 because the empirical record demands assembly.
The evidence base for the structural dispossession of Black Americans is large, well-documented, and distributed across dozens of federal agencies, academic journals, and investigative archives. The tools to access that evidence have never been more available. What did not previously exist is a single instrument that integrates the major dimensions of that record — economic, health, criminal justice, education, housing, political, environmental, and historical — into one open, verifiable, dual-sourced reference document. This paper is an attempt to fill that specific gap.
We do not claim this is the first comprehensive empirical account of Black American life. The National Urban League has published the State of Black America annually since 1976, covering six of the eight dimensions represented here through its Equality Index. The Equal Justice Initiative, Eviction Lab, Sentencing Project, and EPA EJScreen each exceed this paper in depth within their individual domains.
What this paper attempts is different: a single CC0-licensed volume covering all eight dimensions, every quantitative claim independently verified against at least two primary government or peer-reviewed sources, available without fee or institutional affiliation, covering the post–Civil Rights Act window 1991–2024.
We release this paper at a moment when the datasets it draws from are under pressure. Federal environmental justice mapping tools have been rescinded. Research programs that tracked racial disparities in health, wealth, and housing for decades face reduced funding. The analytical vocabulary of structural racism is being contested in public discourse at the same moment the disparities it describes are widening in several dimensions and holding in others. Against that backdrop, the record needs to be held in a form that cannot be defunded, rescinded, or withdrawn behind a paywall. CC0 licensing is the instrument for that form of holding.
This paper is authored by E5 Enclave Incorporated, a Black-led nonprofit based in Liberty City, Miami. Liberty City is not incidental context. It is one of the communities whose structural position this paper documents — redlined in the 1930s, bisected by highway construction in the 1960s, the site of the 1980 rebellion following the acquittal of officers in the killing of Arthur McDuffie, and in 2026 still carrying compound deficits in housing, income, and food access that place it within the geography this paper maps.
On what this paper does and does not do
Eve Tuck's 2009 essay "Suspending Damage: A Letter to Communities" warns against research that pathologizes Black and Indigenous communities even when benevolently intended — research that centers wounds while leaving survivance, institution-building, and self-determination unregistered. We take that warning seriously. This paper measures structural harm. It does not measure — and cannot, within its chosen instruments — the creative, intellectual, organizing, and institution-building capacity of the communities it documents. That dark matter, in Bettina Love's phrase, is real, ongoing, and the reason the communities discussed here have survived conditions the paper describes.
On tradition
The tradition this paper enters is long. Ida B. Wells counted the dead and published the names when no institution would. W.E.B. Du Bois applied social science methodology to Black American life when the academy held the question beneath serious attention. Ella Baker built organizing infrastructure that did not require a charismatic center because she understood that sovereign capacity cannot live in one person. James Baldwin refused the distance of academic prose because the subject was too consequential for comfort.
ii. Methodology and design
*Introduction*What follows is an empirical record of structural conditions affecting Black Americans across eight dimensions of American life, built from federal, academic, and primary-source data across the period 1991 to 2024. It is not the only such record. It is a specific kind of record: CC0-licensed, Black-American-specific, integrating all eight dimensions in one volume, dual-source verified against at least two independent primary sources for every quantitative claim, and freely available to any user for any purpose.
The closest comparator is the National Urban League's State of Black America, which has covered six of these eight dimensions through its Equality Index annually since 1976. The National Equity Atlas (PolicyLink/USC ERI) covers four to five overlapping dimensions through a multiracial rather than Black-specific lens. M4BL's "Vision for Black Lives" spans approximately seven dimensions thematically but is a policy platform rather than an empirical reference.
Empirical window
1991–2024. This 33-year window begins after the dismantling of the explicit legal architecture of Jim Crow and encompasses the period during which the federal civil rights enforcement infrastructure has been nominally operative. The persistence and, in several dimensions, widening of disparities inside this window cannot be attributed to de jure segregation and must be attributed to the structural conditions that formal legal equality left undisturbed.
Dual-source verification
Every quantitative claim in this paper was confirmed against at least two independent primary sources before inclusion. Where sources disagreed on methodology, the methodological difference is noted and the source closer to the federal agency definition was used as the primary figure.
Pillar 1
Economic
Wealth, unemployment, poverty, homeownership. SCF · BLS · ACS.
Pillar 2
Health
Maternal mortality, life expectancy, environmental burden. CDC NVSS · EPA.
Pillar 3
Criminal justice
Incarceration, lethal force, sentencing disparity. BJS · MPV · USSC.
Pillar 4
Education
Achievement gaps, exclusionary discipline, pipeline. NAEP · OCR.
Pillar 5
Housing
Homeownership, mortgage denial, eviction. HVS · HMDA · Eviction Lab.
Pillar 6
Political
Voter participation; gaps between participation and outcome. CPS · OIG · GAO.
Pillar 7
Environmental & food
Toxic burden, food access, sacrifice geographies. EJScreen · FARA · CDC PLACES.
Pillar 8
Historical architecture
The causal record that precedes 1–7. Slave Voyages · NARA · HOLC · COINTELPRO.
iii. One per pillar.
*Headline findings*3. The Wealth Gap.
*Chapter 3*In 1989, the median Black family in the Federal Reserve Survey of Consumer Finances held roughly $12,000 in wealth. In 2022, the median Black family held $44,890. In the same period, median white family wealth rose from about $95,000 to $285,000. The absolute gap grew from $83,000 to $240,120.
Measured against median white wealth, Black family wealth moved from roughly 12.6% in 1989 to 15.8% in 2022 — a gain of about three cents on the white dollar across 33 years.
These are median figures. Mean figures — which capture the tail wealth of the wealthiest households — tell a different story and should not be confused with medians. The Federal Reserve's SCF 2019 reported mean white family wealth at $983,400 and mean Black family wealth at $142,500, while median Black wealth that same year was $24,100. The mean-to-median ratio within Black families alone in 2019 exceeded six to one, reflecting the concentration of Black wealth in a narrow upper segment.
The unemployment constant
Black-to-white unemployment ratio, 1991–2024
BLS · ratio has not dropped to parity in any year
In 1991: Black unemployment 12.5%, white 6.1% — ratio 2.05. At the 2000s expansion peak: Black 7.6, white 3.5, ratio 2.17. In the 2019 pre-pandemic low: Black 6.1, white 3.3, ratio 1.85 — the lowest recorded in the dataset but still a substantial structural gap.
The ratio has not dropped to parity. Across 33 years of expansions and contractions, the unemployment gap between Black and white Americans has closed only at the margins and has reasserted itself at every downturn.
The homeownership architecture
The 2024 Black homeownership rate is 44.7%; the white rate is 74.8% — a 30.1 point gap. In 1994, when this series begins, the gap was 27.7 points. It is larger today than when the data begins.
The mechanism is historical. Between 1935 and 1940, the Home Owners' Loan Corporation mapped 239 American cities and assigned their neighborhoods one of four grades. Grade D — red — coincided with the presence of Black residents. The maps were adopted by the FHA. The 1944 GI Bill provided returning veterans federally guaranteed mortgages. Black veterans were nominally eligible. In practice, the redlined maps meant they could not access the benefit in the neighborhoods where federal underwriters would insure a mortgage.
Sources · Chapter 3
4. Health and the weathering body.
*Chapter 4*The structural-racism framework
Camara Phyllis Jones distinguishes three levels of racism: institutionalized, personally mediated, and internalized. Institutionalized racism — her framework's deepest level — operates through differential access to the goods, services, and opportunities of society, codified in custom, practice, and law in ways that do not require individual intent.
Williams and Mohammed elaborate the pathways: residential segregation, occupational hazard exposure, chronic interpersonal discrimination, and differential policing each produce measurable physiological effects through stress-response pathways and cumulative allostatic load. Bailey et al. (Lancet, 2017) synthesize the evidence that structural racism is a foundational cause of U.S. racial health inequities.
Nancy Krieger's ecosocial theory and Arline Geronimus's weathering hypothesis provide the biological mechanism. Weathering argues that chronic exposure to social, economic, and political adversity accelerates biological aging in ways measurable at the cellular level — shortened telomeres, elevated allostatic load, advanced epigenetic age relative to chronological age.
This is why the maternal mortality gap does not disappear when researchers control for education and income. A Black woman with a college degree and stable income still dies in childbirth at higher rates than a white woman without either. The structural residual after income and education are controlled is weathering.
Maternal mortality, 1991 → 2022
CDC NCHS · per 100,000 live births · 2003 methodology break noted
Sources · Chapter 4
5. The carceral state.
*Chapter 5*The scholarship
Five books form the analytical frame: Michelle Alexander's The New Jim Crow (2010); Khalil Gibran Muhammad's The Condemnation of Blackness (2010); Ruth Wilson Gilmore's Golden Gulag (2007); Elizabeth Hinton's From the War on Poverty to the War on Crime (2016); James Forman Jr.'s Locking Up Our Own (2017, Pulitzer 2018).
Alexander names mass incarceration as a racialized system of social control that replaced — in function if not in form — the earlier legal architecture of Jim Crow. Hinton traces the federal policy chain that produced the architecture, with bipartisan accumulation continuous across Johnson, Nixon, Ford, Carter, Reagan, and Clinton, codified at peak intensity by the 1994 Violent Crime Control and Law Enforcement Act.
The reform era and its limits
1991: Black rate ~2,678 per 100,000; white ~326. Ratio 8.2. 2000: Black 3,457; white 449. Ratio 7.7 — peak of mass incarceration.
The reform era — Fair Sentencing 2010, First Step 2018 — produced measurable but constrained movement. By 2022, Black rate 1,775; white 283. Ratio 6.3. In 22 years of announced reform, the ratio moved 1.4 points. The floor remains above 5.7.
Police killing · 2013–2023
From 2013 to 2023, Mapping Police Violence data record approximately 3,015 Black Americans killed by police, with 377 classified as unarmed at the time of the killing. Over the 10-year period (87,672 hours), this is one killing every approximately 29 hours.
The 2020–2021 period — the year of the George Floyd protests, the largest protest movement in American history — did not reduce the killing. MPV recorded 312 Black Americans killed by police in 2020 (40 unarmed) and 300 in 2021 (29 unarmed). The number of unarmed Black Americans killed by police has not reached zero in any year.
Baltimore, April 2015
On April 19, 2015, Freddie Gray, 25, died of a spinal cord injury sustained in Baltimore Police Department custody. He was arrested for possession of a legal knife, transported in a van without being secured by a seatbelt, and was dead within a week.
The conditions of Sandtown-Winchester at the time of Gray's death: Black male unemployment at 37 percent; Black homeownership declining since 2005; schools overwhelmingly Black and Latino and among the most underfunded in Maryland. The concentration of structural conditions did not produce Freddie Gray's death as a probabilistic event; it produced the geography within which the death occurred.
Sources · Chapter 5
6. The education debt.
*Chapter 6*In 1992, the 8th-grade reading gap between Black and white students on the National Assessment of Educational Progress was approximately 30 scale points. In 2017, it was 25 points. In 2022, it was 25 points.
The gap narrowed, on balance, across three decades of federal education reform — No Child Left Behind, Race to the Top, Common Core, Title I funding expansions — but the narrowing was modest and has stalled.
At the average rate of narrowing across the available 30-year series, parity arrives far beyond the lifetime of children currently in kindergarten. That is the relevant structural fact.
Gloria Ladson-Billings named the correct term for what the NAEP series measures in her 2006 presidential address to the American Educational Research Association. It is not an achievement gap. It is an education debt.
The mechanism · Exclusionary discipline
The research on what suspension produces is unambiguous. Suspended students are more likely to be retained a grade, less likely to graduate on time, and more likely to enter the juvenile justice system. The pipeline is not a metaphor. It is a measured pathway with transition probabilities documented at each stage.
Noguera's finding — that the racial gap in suspension is not explained by behavioral differences — is confirmed by experimental work (Okonofua and Eberhardt, 2015) showing that identical behaviors are perceived and coded differently when attributed to Black versus white students.
Dark matter
Bettina Love's term — dark matter — names the intellectual, creative, and communal genius of Black children that exists entirely outside the test-score frame. NAEP does not measure it. Suspension rates do not measure it. Graduation data does not measure it.
The Black children who attended the same underfunded schools this chapter measures, survived the same suspension pipelines it tracks, and produced the intellectual architecture the chapter sits on are the evidence that the NAEP gap measures the system, not the children.
Sources · Chapter 6
7. Housing and the architecture of exclusion.
*Chapter 7*The scholarship
Richard Rothstein's The Color of Law (2017) dismantles the persistent myth that American residential segregation was produced primarily by private choice. Rothstein documents segregation as explicit, coordinated policy of the federal government — through the FHA's appraisal methodology, public housing siting decisions, zoning ordinances, and racially restrictive covenants that federal agencies required as a condition of mortgage insurance.
Keeanga-Yamahtta Taylor's Race for Profit (2019) documents predatory inclusion: the post-1968 extension of homeownership opportunities to Black buyers in ways structurally designed to extract wealth rather than build it.
The mortgage wall
1995: Black mortgage denial 34.5%, white 16.0% — ratio 2.16. 2007 pre-crisis: Black 20.4, white 11.3, ratio 1.81. 2022: Black 18.1, white 8.3, ratio 2.18.
After 27 years of HMDA reporting and the fair-lending enforcement apparatus it enabled, Black applicants are still denied mortgages at more than twice the white rate. The wall did not move. It was repainted.
Eviction
2000: Black 5.4, white 1.8, ratio 3.0. 2018: Black 5.2, white 1.7, ratio 3.1. Eighteen years. The ratio did not move by a meaningful increment.
Sources · Chapter 7
8. Political participation and its limits.
*Chapter 8*The origin point · Southampton, 1831
On August 21, 1831, Nat Turner led the largest slave rebellion in the recorded history of the United States. The political response was legislative. Virginia, North Carolina, Georgia, and other Southern states passed laws within months prohibiting Black literacy, assembly, and unsupervised religious worship.
The template is the analytical point: when Black organization reached a threshold of material power, legal architecture moved to contain it.
The state's response · Hampton, Newton, Shakur
Fred Hampton, 21, Deputy Chairman of the Illinois chapter of the Black Panther Party, was killed in his Chicago apartment on December 4, 1969, by Chicago police working with FBI intelligence provided through COINTELPRO. Hampton had organized the Rainbow Coalition — a cross-racial political alliance between the Black Panthers, the Puerto Rican Young Lords, and the white Appalachian Young Patriots Organization.
The FBI classified the Black Panther Party as "the greatest threat to the internal security of the country" — J. Edgar Hoover's phrasing, in documents declassified through FOIA litigation in the 1970s.
The duopoly's record
The 1994 Violent Crime Control and Law Enforcement Act, authored by then-Senator Joseph Biden of Delaware and signed into law by President Bill Clinton, allocated $9.7 billion in VOI/TIS prison grants, expanded mandatory minimums, created the federal three-strikes provision, and authorized funding for additional police officers through the COPS program. The statute passed with broad bipartisan support. Its effects concentrated in communities whose voters had helped elect those Democrats.
Crenshaw and intersectionality
Kimberlé Crenshaw has documented that Black women constitute the most reliable and highest-turnout constituency in the American electorate while receiving the smallest aggregate policy return of any demographic group that votes consistently for either party. Black women turned out at the highest rates of any demographic group in 2020. Maternal mortality, incarceration, school funding, and housing architecture in the communities where they live did not fundamentally change under the administration that electoral mobilization produced.
Sources · Chapter 8
9. Environmental conditions and food access.
*Chapter 9*The land beneath Black communities in America is not neutral. The air above them is not shared equally. The water running through their pipes has been the subject of documented government negligence in city after city across decades. The food infrastructure within walking distance has been systematically withdrawn by a commercial sector that made calculations about which neighborhoods were worth serving.
This chapter documents what environmental racism produces in measurable units: pollution burden, blood-lead prevalence by subgroup, Superfund proximity, drinking water violations, farmland loss across a century. These are coordinates, not complaints.
Analytical framework
Robert Bullard, founder of the environmental justice movement as an empirical discipline, surveyed Black communities in Houston, Dallas, Atlanta, Alsen, and Emelle and established that siting of municipal landfills, hazardous waste facilities, and industrial operations followed racial geography with a consistency that could not be explained by land price, zoning history, or any variable other than race.
Beverly Wright, Mustafa Ali, and Wangari Maathai extend the empirical and political frame: from the Petite Côte to the Niger Delta, the destruction of land and the destruction of people are not separate events when the people are of African descent.
The land · Black farmer dispossession
In 1920, Black farmers operated 925,000 farms and held approximately 16 to 19 million acres of farmland under titled ownership. By 2017, Black farmers operated approximately 45,500 farms and held approximately 4.7 million acres.
A 2022 Reuters investigation, drawing on the research of Dania Francis, Darrick Hamilton, Thomas Mitchell, and Bryce Stucki, estimated the present value of lost Black agricultural land at approximately $326 billion.
Flint, 2014
In 2014, a state-appointed emergency manager switched the city's drinking water supply to the Flint River without implementing required corrosion controls, leaching lead from aging pipes into the distribution system. Flint's Black population in the 2010–2014 vintage was approximately 57%.
Flint is not an anomaly. It is the most visible recent instance of the pattern Bullard documented in 1990.
Sources · Chapter 9
x. What the data requires.
*Conclusion*The wealth gap nearly tripled in absolute dollars across 33 years. The maternal mortality ratio has not converged. The carceral floor is 5.7×. The education debt persists at 25 points. The homeownership gap is wider in 2024 than it was in 1994. The voting infrastructure that produced the 2012 turnout peak was struck down within thirteen months. The environmental sacrifice geographies that Bullard mapped in 1990 are still mapped today, with the names of organizers attached.
This paper measures the wound. It does not measure what the communities the wound was inflicted on have built and continue to build. Both records are kept. The communities have been keeping their own records all along, often in the face of the same institutions whose data this paper draws on.
The data is the record. The record is the evidence. The evidence is adequate to the claim.
Methodology
Per-pillar empirical synthesis. Each chapter pairs a megastat anchor with a witness narrative, drawn from peer-reviewed studies, federal data systems, and primary historical sources. Sources block at chapter end. Dual-source verification where evidence permits; named contestation where it does not.
Bibliography
- Federal Reserve. (2022). *Survey of Consumer Finances*.
- Centers for Disease Control. *Behavioral Risk Factor Surveillance System*.
- U.S. Department of Justice. (2023). *Bureau of Justice Statistics*.
- NCES. (2023). *Condition of Education*.
- Rothstein, R. (2017). *The Color of Law*.
- Craemer, T. (2015). Estimating slavery reparations: Present value comparisons of historical multigenerational reparations policies. *Social Science Quarterly*.
How to cite
Lee, I. (2026). Measure the Wound: A Foundational Record of Harms. E5 Enclave.
Lee, Israel. "Measure the Wound: A Foundational Record of Harms." E5 Enclave, 2026.
@misc{lee2026measure,
  author = {Lee, Israel},
  title = {Measure the Wound: A Foundational Record of Harms},
  year = {2026},
  publisher = {E5 Enclave},
  url = {https://e5enclave.com/record/measure-the-wound/}
}
Download .bib
Set in Cormorant Garamond & Inter. Convened in Liberty City. For the next thousand years.